Preliminary Remarks
The executor is that part of Structorizer that tries to interpret and execute a diagram. It is available e.g. via the "Debug" menu:
")
Please note, that Nassi-Shneiderman (NS) diagrams are designed to be free of any syntax. That means you may put arbitrary descriptive text into the elements. It depends on the level of detail, of course, how much sense that makes. Often it is more practical to use more formal notations like pseudo code or even more or less commonly accepted programming language constructs.
In order to "execute" an NS diagram, however, you have to stick to some kind of syntax. For the same reason, not all diagrams nor all contained structures can be interpreted. The executor was added to allow beginners to easily catch and understand control structures and execution flows. Over the time, however, several enhancements and accomplishments have made it a lot mightier than originally planned. You find an overview of the executable dialect used in Structorizer on the Syntax page of this user guide.
Overview of the remaining subsections of this manual page:
Launching Executor
To launch the executor, you may use the menu item "Debug › Executor ..." (see above) or click on the following toolbar icon:  . This will pop up the Executor Control panel (the functions of which will be described in section "Executor Control" further below): . This will pop up the Executor Control panel (the functions of which will be described in section "Executor Control" further below):

If your algorithm contains Turtleizer-specific subroutines, however, then you must click on the Turtle icon in the toolbar or select the menu item "Debug › Turtleizer ..." instead (unless the Turtleizer window has already been opened):  . .
Note: You cannot close the control panel by the operating-system-typical close button (e.g. the top-right red 'X' in Windows, see image above, or the red traffic-light button in OS-X) while an execution is running or pending. Since release 3.27 you will be warned if you try.
The control panel will close automatically on execution termination unless Runtime Analysis is active. (From version 3.30-07 to 3.30-11 it remained always open but in practice this did not really work, see issue #829 for the reasons). You may close it by pressing the  button or iconize it in the usual way if it disturbs you in Runtime Analysis mode. button or iconize it in the usual way if it disturbs you in Runtime Analysis mode.
Executor Control
Here we explain the details of the Executor Control (opened e.g. via buttons or , as stated before). You see its layout in the figure above.
"Player" buttons
The most important controls are the four "player" buttons in the fourth row, having the following effect (from left to right):
- (Stop): Aborts execution immediately and closes the control window (unless Runtime Analysis is active), all execution status will be lost (tracked runtime counts will survive, though).
 (Run): Starts or resumes execution with the current instruction, running with the delay set via the slider in the first row. (Run): Starts or resumes execution with the current instruction, running with the delay set via the slider in the first row. (Pause): Interrupts execution but retains current execution status such that, after some inspection and interaction, execution may be resumed. (Pause): Interrupts execution but retains current execution status such that, after some inspection and interaction, execution may be resumed. (Step): Just executes the current instruction and then automatically pauses before the next instruction or the end of the algorithm. (Step): Just executes the current instruction and then automatically pauses before the next instruction or the end of the algorithm.
From version 3.30-14 on, the Pause button will temporarily be substituted by the following button while you pause on a CALL element (see CALL execution below):
 (Step into): Descends into the called subroutine diagram and continues the debugging within it (e.g. by stepping through it). (Step into): Descends into the called subroutine diagram and continues the debugging within it (e.g. by stepping through it).
When having started with button Run, the execution will terminate in one of the following cases:
- The last instruction of the algorithm has been reached and executed.
- An EXIT element containing an exit instruction has been executed.
- An EXIT element containing a return instruction has been executed and the currently executed diagram is at top level.
- The Stop button has been pressed.
- A syntax or execution error has occurred.
The execution will pause (i.e. may be resumed) on one of the following events:
- Execution was carried out with the Step (or the Step into) button.
- The Pause or Step button was pressed during execution.
- A breakpoint is reached.
- An input instruction is executed and you pressed the "Cancel" button in the popped-up input dialog.
- An output instruction is executed (unless output mode is "output to window") and you pressed the "Pause" button in the popped-up display dialog.
- A subroutine CALL executed with Step over returned.
Some activities (like Call stack display) will only be enabled in paused state.
You resume execution via the Run or Step button (or the Step into button in case of a CALL element in versions ≥ 3.30-14).
Execution delay
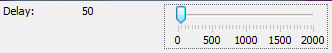
With the slider in the top row you may control the execution delay between the instructions (for better observation). Whereas the mouse handling is rather rough, you may use cursor keys (left / right) to increment or decrement the delay value by 1 while the slider is selected. If you reduce the delay to 0 then some displayed information (like variable values, execution counts etc.) may not be updated unless the algorithm turns into paused state due to one of the events described above.
Output mode
The second row provides a checkbox "Output to window" allowing you to specify how output instructions are presented: If the checkbox is not selected then output instructions will pop up a message box showing the output value and having to be quit each time in order to resume, otherwise a console-like text window (see section "Output Console Window" below) will permanently be open into which all output will be written without pausing or waiting. Since the output is always logged to that console window (even while not being visible), you may still inspect the entire output history of the program by selecting the checkbox after having executed the algorithm with unselected checkbox. You may possibly have to open the Executor Control again to do so, because it usually closes after execution has terminated. Some examples are given in the section "Output Console Window" further below.
Runtime Analysis control

The third row provides a checkbox and a visualisation mode choicelist for Runtime Analysis. The checkbox on the left-hand side enables the tracking mode, the choicelist modifies the kind of element highlighting in dependency of the purpose of the analysis. The controls are partially disabled while execution is ongoing. See the Runtime Analysis page for details.
Call stack display

The fifth row shows you the current subroutine call level on the right-hand side: Every CALL instruction, which the execution dived into, increments the subroutine level by one, on returning from a called subroutine (and thus leaving the pending CALL element) the subroutine level is decremented. The top level (program level) is 0. Note that built-in functions or procedures do not affect the displayed subroutine level; only called Nassi-Shneiderman diagrams have an impact. In paused execution state, a click on the "Call Stack" button will pop up a scrollable list view showing the current content of the call stack (see section "Call Stack" below).
Variable display

The lower region of the control panel is occupied by the variable display. As soon as a new variable is introduced, a new line will be added with the variable name in the left column and a string representation of its current value in the right column. In lines with a composed value (i.e. an array or record) the central column will show a pulldown button.
By the way: The three (and a half) ways to introduce a variable in Structorizer (the variables are named id1 through id5 in the examples) are these:
- as parameter of the (currently executed) subroutine, e.g.: function(id1, id2)
- as target of an assignment instruction, e.g.: id3 <- expression
- as target of an input instruction, e.g.: INPUT id4
- by means of a declaration, e.g.: var id5: integer
(Note that a mere declaration without assignment leaves the variable in an uninitialized state.)
Whenever execution pauses (see above), you may double-click into a field in the right column of the variable display and edit the value for testing purposes or have a look at the farther-right elements of a large array exceeding the column width. The value of a displayed constant cannot not be edited, though. Constant values are indicated by a pink table cell background. Enumerator types introduce all their enumerator elements at once as constants where the name of the type is shown in parentheses appended to the numeric value:

|

|

|
Displayed enumerator elements after
the type definition "Month" |
Enumerator elements with explicitly
associated code (after type definitions "Month"
and "Leapy") |
You may inspect or change structured values by pressing the associated pulldown button in the central column. This will open a table view similar to the variable display, allowing to inspect (and possiby modify) the content in a structured way:
 
The value inspection works recursively into nested data structures. The respective title string reflects the access path:

If the inspected value was a constant then you will not be able to apply changes, the icon will be a magnifying glass instead of a pencil, and there is only an "OK" button instead of a "Discard" and a "Commit"/"OK" button.
Variables of an enumerator type may show the symbolic name of their value in the variable display rather than the integer code. For variables not explicitly declared this may sometimes fail (then you will just see the internal code, see left figure below). If an enumerator value is part of a structured data chunk then it will always be represented by its integer code. If you open the table view for such a complex value as described above such that the enumerator value would have its own row then it will show the symbolic name. If the symbolic enumerator name is shown then you will sensibly obtain a choice list on double-clicking the cell in order to edit the value (see right figure below):
|

|

|
Display of enumerator value with
missing type information |
Choice list on editing an enumerator
variable after successful type inference |
When you resume the execution, the algorithm will continue with the modified value(s). Note that the Start and Step buttons will be locked until you finish or discard editing (by <Enter> or <Esc> or by clicking elsewhere).
Animation
The currently executed or paused instruction is highlighted with an amber background. Compound elements with pending execution, i.e. nested components of which being currently executed (or paused), are highlighted in a cream tinge. So you may easily follow the execution progress (see image in next section).
Within PARALLEL elements, those parts of the threads that have already been passed are also marked with the cream tinge; because of the randomly leaping execution you would otherwise hardly be able to tell how far the different threads may have proceeded.
Additionally, in Runtime Analysis mode, elements already passed by one of a series of performed test executions can be highlighted in bright green to visualize test coverage. Alternatively, elements may be highlighted in a spectral colour range depending on their relative execution count or the number of involved "atomic" operations. This colouring is lower prioritized than the above mentioned highlighting for the current execution status (currently executed element and structured elements with pending execution completion).
The speed of the animation is controlled by the delay slider in a range between 0 and 2000. The default is 50.
CALL execution

If you pause at a CALL element (maybe you reached it in step mode, or a breakpoint was set on it or you happened to press the Pause button when Executor was going to run into it, see screenshot above) then the Pause button will be substituted by a button with the following symbol: (in versions ≥ 3.30-14).

Now you will have the choice among two different ways to handle the CALL on further debugging in stepwise mode:
- (Step into): This will immerge into the called subroutine diagram and execute it element by element in step mode.
- (Step over): This will execute the subroutine as a whole and pause at the next element after returning from the CALL.
Before version 3.30-14, the Step button always descended into the CALL. In order to step over it you had to use the Run button after having placed a breakpoint behind the CALL (which was inconvenient and not even always possible, e.g. at the end of a routine or sequence).
Breakpoints
You may place breakpoints on as many elements of your diagram as you like. Execution will pause as soon as an element with breakpoint is reached (for possible actions in paused state see above).
To set or remove a breakpoint select the respective element and now either right-click and select/unselect menu item " Toggle breakpoint" in either the "Debug" or context menu or double-click and select/unselect the checkbox "Breakpoint" at the bottom of the element editor. Alternatively, you may press accelerator key <Ctrl><Shift><B>. Toggle breakpoint" in either the "Debug" or context menu or double-click and select/unselect the checkbox "Breakpoint" at the bottom of the element editor. Alternatively, you may press accelerator key <Ctrl><Shift><B>.

In the diagram, a breakpoint is shown as a horizontal red bar at the top of the element frame (except for REPEAT loops, where the red bar will appear between loop body and exit condition, sensibly):

If you place a breakpoint on a loop (FOR, WHILE, REPEAT) then the execution will pause every time the loop condition is going to be checked again.
Note that you can't place a breakpoint on an ENDLESS loop (since it hasn't got any means of control). You may place a breakpoint on the first element of its body instead.
While Runtime Analysis mode is active you can also make use of conditioned breakpoints: You may specify an execution count value that is to trigger the breakpoint on going to be reached. That means while the element hasn't been executed as often as specified, the breakpoint will be passed as if it weren't there. Only when the current execution count (on entering the element) exactly equals the specified trigger value minus one (such that it would draw level with it on completion), the breakpoint will go off. Conditioned breakpoints are shown as a dotted red line, and their trigger value will — coloured in red — precede the runtime counts as shown in the T(RUE)-branch in the following screenshot (where the result assignment just triggered it):

A trigger value of 0 specifies an unconditioned breakpoint as described before.
Since a conditioned breakpoint won't fire again after the (non-zero) trigger count has been exceeded, you are allowed to modify the trigger value whenever the execution is paused. To do so for a selected element you may use the menu item "Specify break trigger..." in menu "Debug" or in the context menu, or just enter the key combination <Ctrl><Alt><B>:

Wenn you toggle off the breakpoint then its trigger value will not get lost but is preserved for later re-activation.
In order (temporarily) to disable all breakpoints over all diagrams at once press the speed button  in the toolbar or the respective menu item "Ignore all breakpoints" in the "Debug" menu (see menu screenshot farther above). Note that this is the new effect of the button / menu since version 3.31-02; in prior versions it eliminated all breakpoints from the current diagram, but the usability of that behaviour had turned out to be very poor: during recursive execution it did not affect other instances of the routine on the call stack (such that cached breakpoints reappeared like zombies, see third note below) and to reactivate the lost breakpoints they had to placed individually again. in the toolbar or the respective menu item "Ignore all breakpoints" in the "Debug" menu (see menu screenshot farther above). Note that this is the new effect of the button / menu since version 3.31-02; in prior versions it eliminated all breakpoints from the current diagram, but the usability of that behaviour had turned out to be very poor: during recursive execution it did not affect other instances of the routine on the call stack (such that cached breakpoints reappeared like zombies, see third note below) and to reactivate the lost breakpoints they had to placed individually again.
Note:
- Breakpoints are not saved to file.
- To set, modify, or remove a breakpoint will not induce an entry in the undo or redo stack. However, any undoable (substantial) change to a diagram will be associated with a snapshot of all currently set breakpoints, such that on undoing a previous diagram modification the former breakpoint status would be restored. The same holds on redoing undone modifications.
- If you place a breakpoint on an element within a recursive routine during execution then the breakpoint will only apply to the current and all new deeper call stack levels, but not to outer levels. And it will be gone after execution if you had placed it in a recursion depth > 0.
Output Console Window
By selecting the "Output to window" checkbox you will open a text window logging all done output and input, as mentioned in section Executor Control above.

On starting execution, any previous content gets deleted, an automatically generated meta-line will name the executed program (or top-level routine) and show the starting day and time (in light-gray letters). Conversely, on terminating an execution a similar meta-line with the termination time will be displayed (see image above).
There is no way to input or edit something in the logging window. Input instructions will always be carried out via an interactive question box, but both the automatically generated prompt text and the input will be reflected here (the former in yellow colour, the latter as green text for better distinction). The regular output produced by the algorithm output instructions is shown in white colour. Every output instruction induces a new line:

With checkbox "Output to window" not being selected, the window will just stay hidden but still exists and gathers the texts printed during execution in the background. There is an important difference with respect to the way output works, however:
- In switched-of mode, each output instruction will pop up a message box and pause execution until you confirm. The output will additionally be logged in background to the hidden window.
- With "Output to window" selected, all output is only written to the (displayed) output window without pausing. So this mode relieves you from the necessity to confirm every single output and allows continuous execution flow (which is particularly helpful with algorithms generating a lot of output).
You may change the output option at any time during or after an execution without losing the window content. If you happened to close the window via its close button then don't panic: Evry output or input action of the algorithm will bring it up again. Moreover, you may reactivate it by unselecting and re-selecting the "Output to window" checkbox or, of course, by starting a new execution.
The font of the output window may be changed by menu, via the + and - keys on the number pad in combination with the <Ctrl> key, or — since version 3.28-01 — via the mouse wheel with the <Ctrl> key being pressed:

Execution errors will also be logged in red colour to the output text window after having popped up as error message box. See an example in section "Custom subroutines" above.
Since version 3.28-07, there is also a "Contents" menu where you may switch off the logging of the Executor meta texts (like the start and termination time, reports on variable value manipulations in the value display during pause and so on). By default, the logging of these messages is enabled:

On the other hand, you may switch on an indented tracing of subdiagram calls — both on entry (marked with prefix ">>>") and exit (marked with prefix "<<<"), which is a particularly nice feature to demonstrate recursion. If the call level exceeds the value of 40 then the level is numerically given in brackets rather than further indented:

Saving the window contents:
Of course you may always select a subsection of the window content (or the entire log via <Ctrl><A>) and then copy and paste it e.g. to some text editor. With very huge logs this might fail, however; not only for these cases there is a menu item "Save log ..." now in the "Contents" menu, which allows you to save the current window content to a text file of your choice.
Used text colours
| Colour |
Kinds of messages |
| white |
Algorithm output |
| yellow |
Input prompts |
| green |
User input |
| gray |
Start and termination info, call entry and exit |
| cyan |
Subroutine argument input and result output (if executed on top level) |
| red |
Error and abort messages, value manipulations in the variable display |
Call Stack
As mentioned in section Executor Control above, you may display the call stack (makes only sense with diagrams containing — possibly nested — CALLs, of course). By clicking the button "Call Stack" you open the stack trace window. To display a call stack requires a begun execution (of a diagram containing CALL elements) being currently paused (e.g. by pause button or breakpoint or in step mode).
The top line always represents the innermost call (i.e., the currently executed subroutine call), the bottom line (level 0) stands for the main program or routine initially started. Some examples for call stack views are shown below:

Scrollbars are automatically added when required, e.g.:


Restrictions And Trouble During Testing
If you try to start Executor for a diagram while you haven't terminated another debugging session (say you have looked for certain other diagram from Arranger in paused mode and forgotten that the debugging is still pending or you just pressed the button again while the Control panel is hidden somewhere behind the current window), then you will be warned by a message box saying that there is a running execution:

Now you have two options:
- To abort the pending execution in order to start a new one.
- To back off by pressing "No", which will bring the possibly hidden or iconized Control panel up to top (such that you will not even have to look for it among the open windows) to facilitate resuming execution.
Likewise, you may get such a choice if you try to edit a diagram while its execution is pending (which would cause inconsistency of the Executor state). Some modifying actions are just disabled during execution, however, so selecting them won't have any effect.
In very rare cases, however, e.g. after some unexpected internal malfunction or if you managed to circumvent the edit protection in paused state, the Executor may get stuck in an inconsistant state. So you may see the above message box but aborting the current execution just doesn't work, i.e. on your next attempt to start the debugging again the same message occurs and so forth on end. Or you decide not to abort the execution but to resume and this fails. Then the only reliable way to get rid of the resilient zombie session will be to close down Structorizer (after having saved all relevant changes, of course) and to reopen it. |