|
The Analyser may statically check the current diagram for certain syntactical and structural deficiencies. Which ones of the available checks are to be performed is configurable (see below). The analysis is done at live time (i.e. during editing) and reports detected potential problems in the report area below the diagram work area.
To enable or disable the static Analyser as a whole you may use menu item "View › Analyse structogram?" or simply press <F3> (see Settings > Analyse structogram?). In the Analyser Preferences you may opt in or out any of the individual rules available for the analysis. You may also opt out the placing of little marker triangles in elements with associated warnings or hints as introduced with version 3.30-14 (see examples in the screenshots below). Consult Analyser Preferences for a list and a short explanation of the rules.
The analyser report area is only visible while the Analyser is enabled. (During execution the static analyser will be temporarily disabled.) Simply drag the horizontal separating border up or down to tune the display ratio between the work area and the report list. (If you don't see the report area even though you had enabled Analyser then try cautiously to drag the bottom border of the diagram area upwards into the Structorizer work ara. In contrast, there are very rare cases that Structorizer may start with the report area occupying the entire place below the toolbar — then drag the upper border of the report area down to give the work area its share.)
When you see warnings in the report area, just click on one of the report lines to select and highlight the corresponding element in the diagram. If you double-click on a report line, this will even open the editor for the related diagram element.

In the above example, you see three detected problems in the Analyser report area (the bottom section). The causing elements are additionally marked with red triangles (a new optional feature introduced with version 3.30-14, see Analyser Preferences). From version 3.31-05 on, you may raise a tooltip showing all warning messages related to the element by having the mouse hovering over such a triangle:

The first two of the messages refer to instruction 1: In the expression, variable b is used, but its initialization hasn't been performed yet, it's following in an instruction executed later. For identifier c in the same expression no initialization at all could be found anywhere (c is not bold in the diagram, therefore). The responsible rule for this kind of analysis is "Check for non-initialized variables". This rule also checks for variables the initialization of which may not necessarily be reached, e.g. because it is placed in a branch of an Alternative or whithin a loop. Such cases are reported with a slightly differing message.
The third of the messages relates to the body of the FOR loop where a manipulation of the control variable i is tried, which is usally regarded as illegal (though some programming languages like C or Java allow such questionable ways to control the loop, e.g. to leave it prematurely; you may even frequently see them used). The responsible Analyser rule is "Check for modified loop variable".
Likewise, loops where the body has no obvious influence on the loop condition (such that an accidential endless loop may be supposed) may be detected via a different rule etc.
(As mentioned above, see Analyser Preferences for a list of available rules.)
Of course, you may neither rely on a "complete" analysis nor should you be sure that all messages are correct, i.e. there may be "false positives", since a structogram may neither be expected to adhere to strict syntactic rules nor is it possible at all to decide certain semantic properties of an algorithm algorithmically. (The undecidability of many interesting algorithm properties is proven!)
Since version 3.30-15, the report list will automatically scroll to the first warning that is related to the element you just selected. More precisely, it will ensure that the first related warning gets visible in the report list viewport (this does not necessarily mean it will be the first line in the viewport).
If a collapsed element shows an Analyser marker then the respective tooltip (see above, since version 3.31-05) will list the problems of all contained elements after a short description of the causing element:

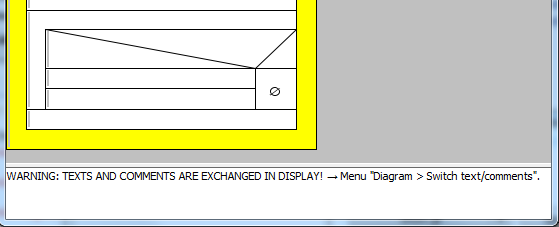
Since version 3.24-15, Analyser will place an element-independent warning at the top of the Report List while mode Switch text/comments is active:
Note: Besides static analysis you may also perform runtime analysis, which is a separate feature of the Executor.
Since release 3.27, the Analyser Report List is also used to guide beginners through the creation and use of some simple diagrams:

When you let the mouse hover over a marker triangle (see above), related tutorial hint messages in the tooltip will appear in blue colour as well, such that they can easily be told from warnings (version ≥ 3.31-05 only).
For more details see Guided Tours / Tutoring. |